

 GA4 is a dumpster fire. Well, it’s great for data collection, but the UI is a hot piece of trash when it comes to report generation.
But don’t worry—Looker Studio can save the day. We used Looker Studio (formerly called Data Studio before Google acquired Looker) for many years before GA4’s launch, but now it has become more essential than ever.
Using Looker Studio for Building SEO Reports
When it comes to pulling together the SEO data for your business, nothing beats Looker Studio. You can pull data from a multitude of sources, including Google Google Analytics 4 (GA4), Google Search Console, and Google BigQuery – as well as any other non-Google product that offers an API. There are many pre-built Community Connectors for importing data from popular SEO tools such as SEMrush* and SERPstat.
Read on to see what you should include in your Looker Studio SEO report.
What Data Does a Good SEO Report Include?
A good SEO report should include a good amount of data, but not enough to overwhelm the client.
- Easy-to-understand Summary: A good SEO report should contain a text section with a high-level overview of the report’s performance written by you. We handle this by connecting a Google Sheet to a table in Looker Studio so that each month’s custom-written analysis shows up in the correct time frame.
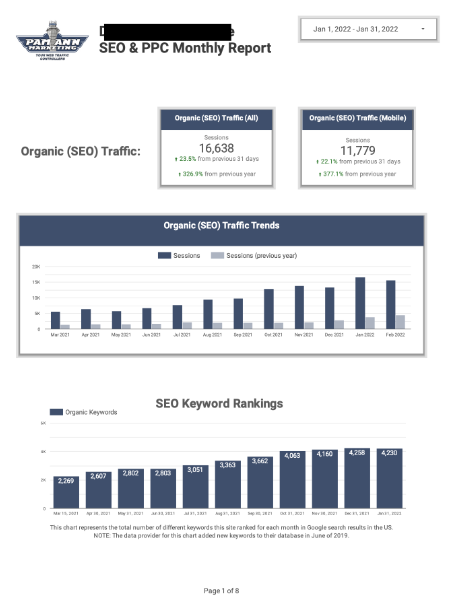
- Keyword Rankings: Before a client can get organic search traffic, they must have a presence in search engines. We track the number of ranking keywords as a “lead-up” metric. This metric, once it grows enough, leads to increases in organic search traffic. It’s also important for identifying “low hanging fruit” – content that is ranking in a low position for certain keywords that could be improved to move higher.
- Organic Search Traffic: Obviously, clients want to know how much traffic they are getting. But it’s most impactful if you include month-over-month and year-over-year comparisons, as well as a time series chart so the client can see progress over time. Looker Studio makes this easy.
- SEO Conversions: We call this the “mother metric” – it’s the bottom line must-have metric for any SEO campaign.
- SEO Conversion Rate: It’s important to show the value of SEO by comparing the conversion rate of the organic search traffic to other marketing channels. Oftentimes, SEO traffic converts at a better rate than other sources. Showing this data can help you retain your SEO clients.
- Top SEO Landing Pages: It’s important to show clients what content is performing well so they can do more of what works.
- Bounce Rate: It’s also important to show clients what is not working by examining the Bounce Rates of top performing content.
- Page Speed: This is a super important technical SEO metric that should be monitored regularly.
- Domain Authority: Here, we believe that quality is more important than quantity, so tracking a metric such as Domain Authority or Authority Score, whatever your preferred SEO tool calls it, is our recommended metric for tracking off-page SEO efforts, versus quantity of backlinks. That being said…
- Number of Referring Domains: We like this metric as it indicates whether or not the client is doing the proper PR work to get their site linked to from new sources.
Customize Your Looker Studio SEO Reports By Adding Logos
You can white-label your Looker Studio SEO by adding your agency’s logo to the top as a report header. Alternatively, you can fully brand the report with your client’s logo and colors.
Need Help Setting Up Your Looker Studio Reports?
Using Looker Studio, we can create customized reports that organize your data in an easy-to-understand way. This way, you can spend less time hunting for the data you need and more time growing your business.
Looker Studio isn’t limited to generating SEO reports—it can be integrated with almost any application that offers API access, giving you access to all your data in one place.
For marketing agencies, we can also “white label” reports for your clients using your brand assets.
We can also train your staff on a one-off or regular basis to do any of our specialties, including Looker Studio.
*This post may contain affiliate links.